mini-map-maker
A tool for automatically generating 3D printable STLs from freely available lidar scan data.
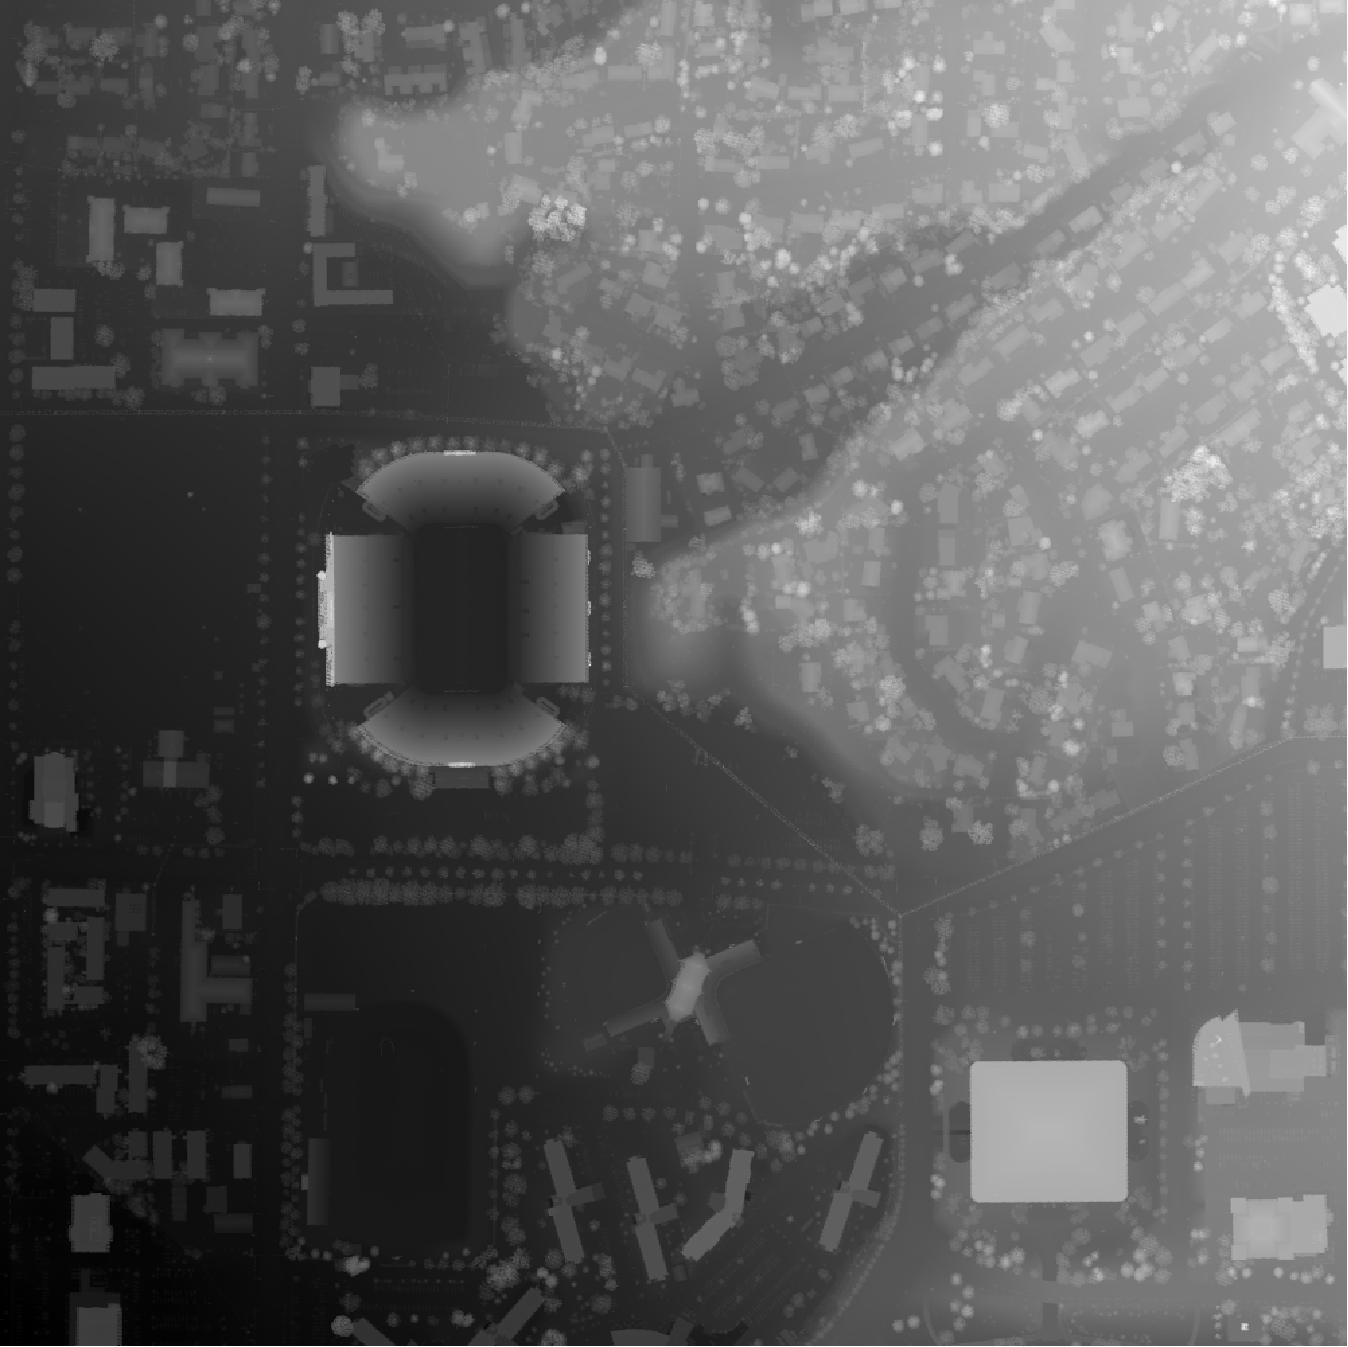
Screenshots

Tutorial
To use this script, go to the USGS LidarExplorer
https://prd-tnm.s3.amazonaws.com/LidarExplorer/index.html#/
Select an area, and then click the "Download list" button under "Lidar within AOI"  This should give you a file called
 downloadlist.txt. Simply place this text file in the same directory as the script, and then run the script (convert.py, or convert.exe if you don't want to deal with Python). By default, mini-map-maker will generate an STL file for each tile in the lidar data. However, there are quite a few command line arguments that you can use to customize the output.
>convert.py -h

usage: convert [-h] [--input INPUT] [--reduce REDUCE] [--vscale VSCALE]
               [--base BASE] [--merge] [--no_stl] [--cleanup] [--filter FILTER] [--prj]

A utility for automatically generating 3D printable STLs from USGS lidar scans.

optional arguments:
  -h, --help            show this help message and exit

  --input INPUT, -i INPUT
                        The name of the file containing the URLs of all of the lidar scan data.

  --reduce REDUCE, -r REDUCE
                        A decimal value that will decrease the output file size as it increases.
                        The default value is 1.0

  --vscale VSCALE, -v VSCALE
                        A decimal value that will make artificially make things taller as it increases.
                        The default value is 1.0

  --base BASE, -b BASE  A decimal value that sets the base height of the model. The default value is 0.0

  --merge, -m           Using this flag will merge all of the point clouds into one file before converting into a DEM.

  --no_stl, -s          Using this flag will disable STL generation.

  --cleanup, -c         Using this flag will cause the program to automatically delete the unzipped point cloud files
                        after running.

  --filter FILTER, -f FILTER
                        A percent value (0-100, for the slope of the points being smoothed) that will enable the spike
                        smoothing option. This is good if you have points that are floating way up above the model and
                        causing spikes in your final model.

  --prj, -p             Using this flag will cause the program to automatically download and use lastools to generate
                        projection files for the elevation models. This is important if you want to generate the STLs
                        yourself in QGIS, but it means you'll have to be mindful of lastool's license limitations.
                        More info on lastool's website (https://rapidlasso.com/lastools/).

  --external_files, -e  Using this flag will grab las/laz files from the LAS directory instead of downloading them from
                        an input list.
Additional Examples:
External Files
Let's say you already have some las files you want to use. Simply place them into a directory called LAS, and then call the script from from the directory containing the LAS folder, using the --external_files flag, like so:
convert.py --external_files
This trick also works with LAZ files, or even a mix of LAZ and LAS files.
Adding a Base and Manipulating the Output
For one project, I had a LAZ file that had a section of ocean. This caused the output to be super flat, and too thin in several places to print well. Additionally, it was a pretty high resolution file, so the output STL was very large, and I wasn't happy with the vertical scale of the file either. So, after placing my LAZ file into a directory labeled LAS like mentioned above, I used the following command:
convert.py --external_files --filter 50 --base 10 --vscale 0.5 --reduce 2
Filtering got rid of some weird spikes in the output STL, and the base command increased the total height of the output. The vscale command made the model shorter, and reduce significantly decreased the size of the STL.
Support This Project
Like this project? Feel free to make a donation.

Licensing
With the default options, this program is completely open source, and the output is usable in a commercial environment. This code itself is MIT License, as is r-barnes' DEMto3D library that this program makes use of.
https://github.com/r-barnes/DEMto3D
If you want to use the output in QGIS or another GIS program, and enable .prj file generation, then the sript will automatically download lastools. The .prj files generated are free to use if it's not for commercial purposes. If you plan on using the .prj files for commercial purposes, you will need to purchase a lastools license in accordance with the information on lastool's website:
https://rapidlasso.com/lastools/
Additionally, this script makes use of some public domain utilities from FUSION by the US Forest Service
http://forsys.sefs.uw.edu/FUSION/fusion_overview.html
With the addition of LAZ processing, this project now utilizes LASzip, an LGPL-2.1 tool. It is included as a precompiled binary (laszip-cli.exe), and no modifications have been made.

 4 Feb 07, 2022
 185 Jan 06, 2023
 7 Dec 30, 2022
 16 Nov 26, 2022
 9 Dec 13, 2022
 1k Jan 01, 2023
 13 Oct 27, 2021
 67 Nov 24, 2022
 37 Nov 25, 2022
 13 Jul 16, 2022
 14 Aug 14, 2022
 150 Dec 28, 2022
 1 Mar 10, 2022
 5 Nov 18, 2022
 1 Nov 20, 2021
 844 Dec 27, 2022
 5 Nov 12, 2022
 2 Dec 16, 2022
 2 Dec 24, 2021
 5 Jan 06, 2022