Sci palettes for matplotlib/seaborn

Overview

sci palettes for matplotlib/seaborn

Installation

python3 -m pip install sci-palettes

Usage

import seaborn as sns
import matplotlib.pyplot as plt
import sci_palettes


print(sci_palettes.PALETTES.keys())

sci_palettes.register_cmap()          # register all palettes
sci_palettes.register_cmap('aaas')    # register a special palette

# methods for setting palette
plt.set_cmap('aaas')
plt.style.use('aaas')
sns.set_theme(palette='aaas')
sns.set_palette('aaas')

sns.scatterplot(...)

# set palette when plotting
sns.scatterplot(..., palette='aaas')

Full examples in examples
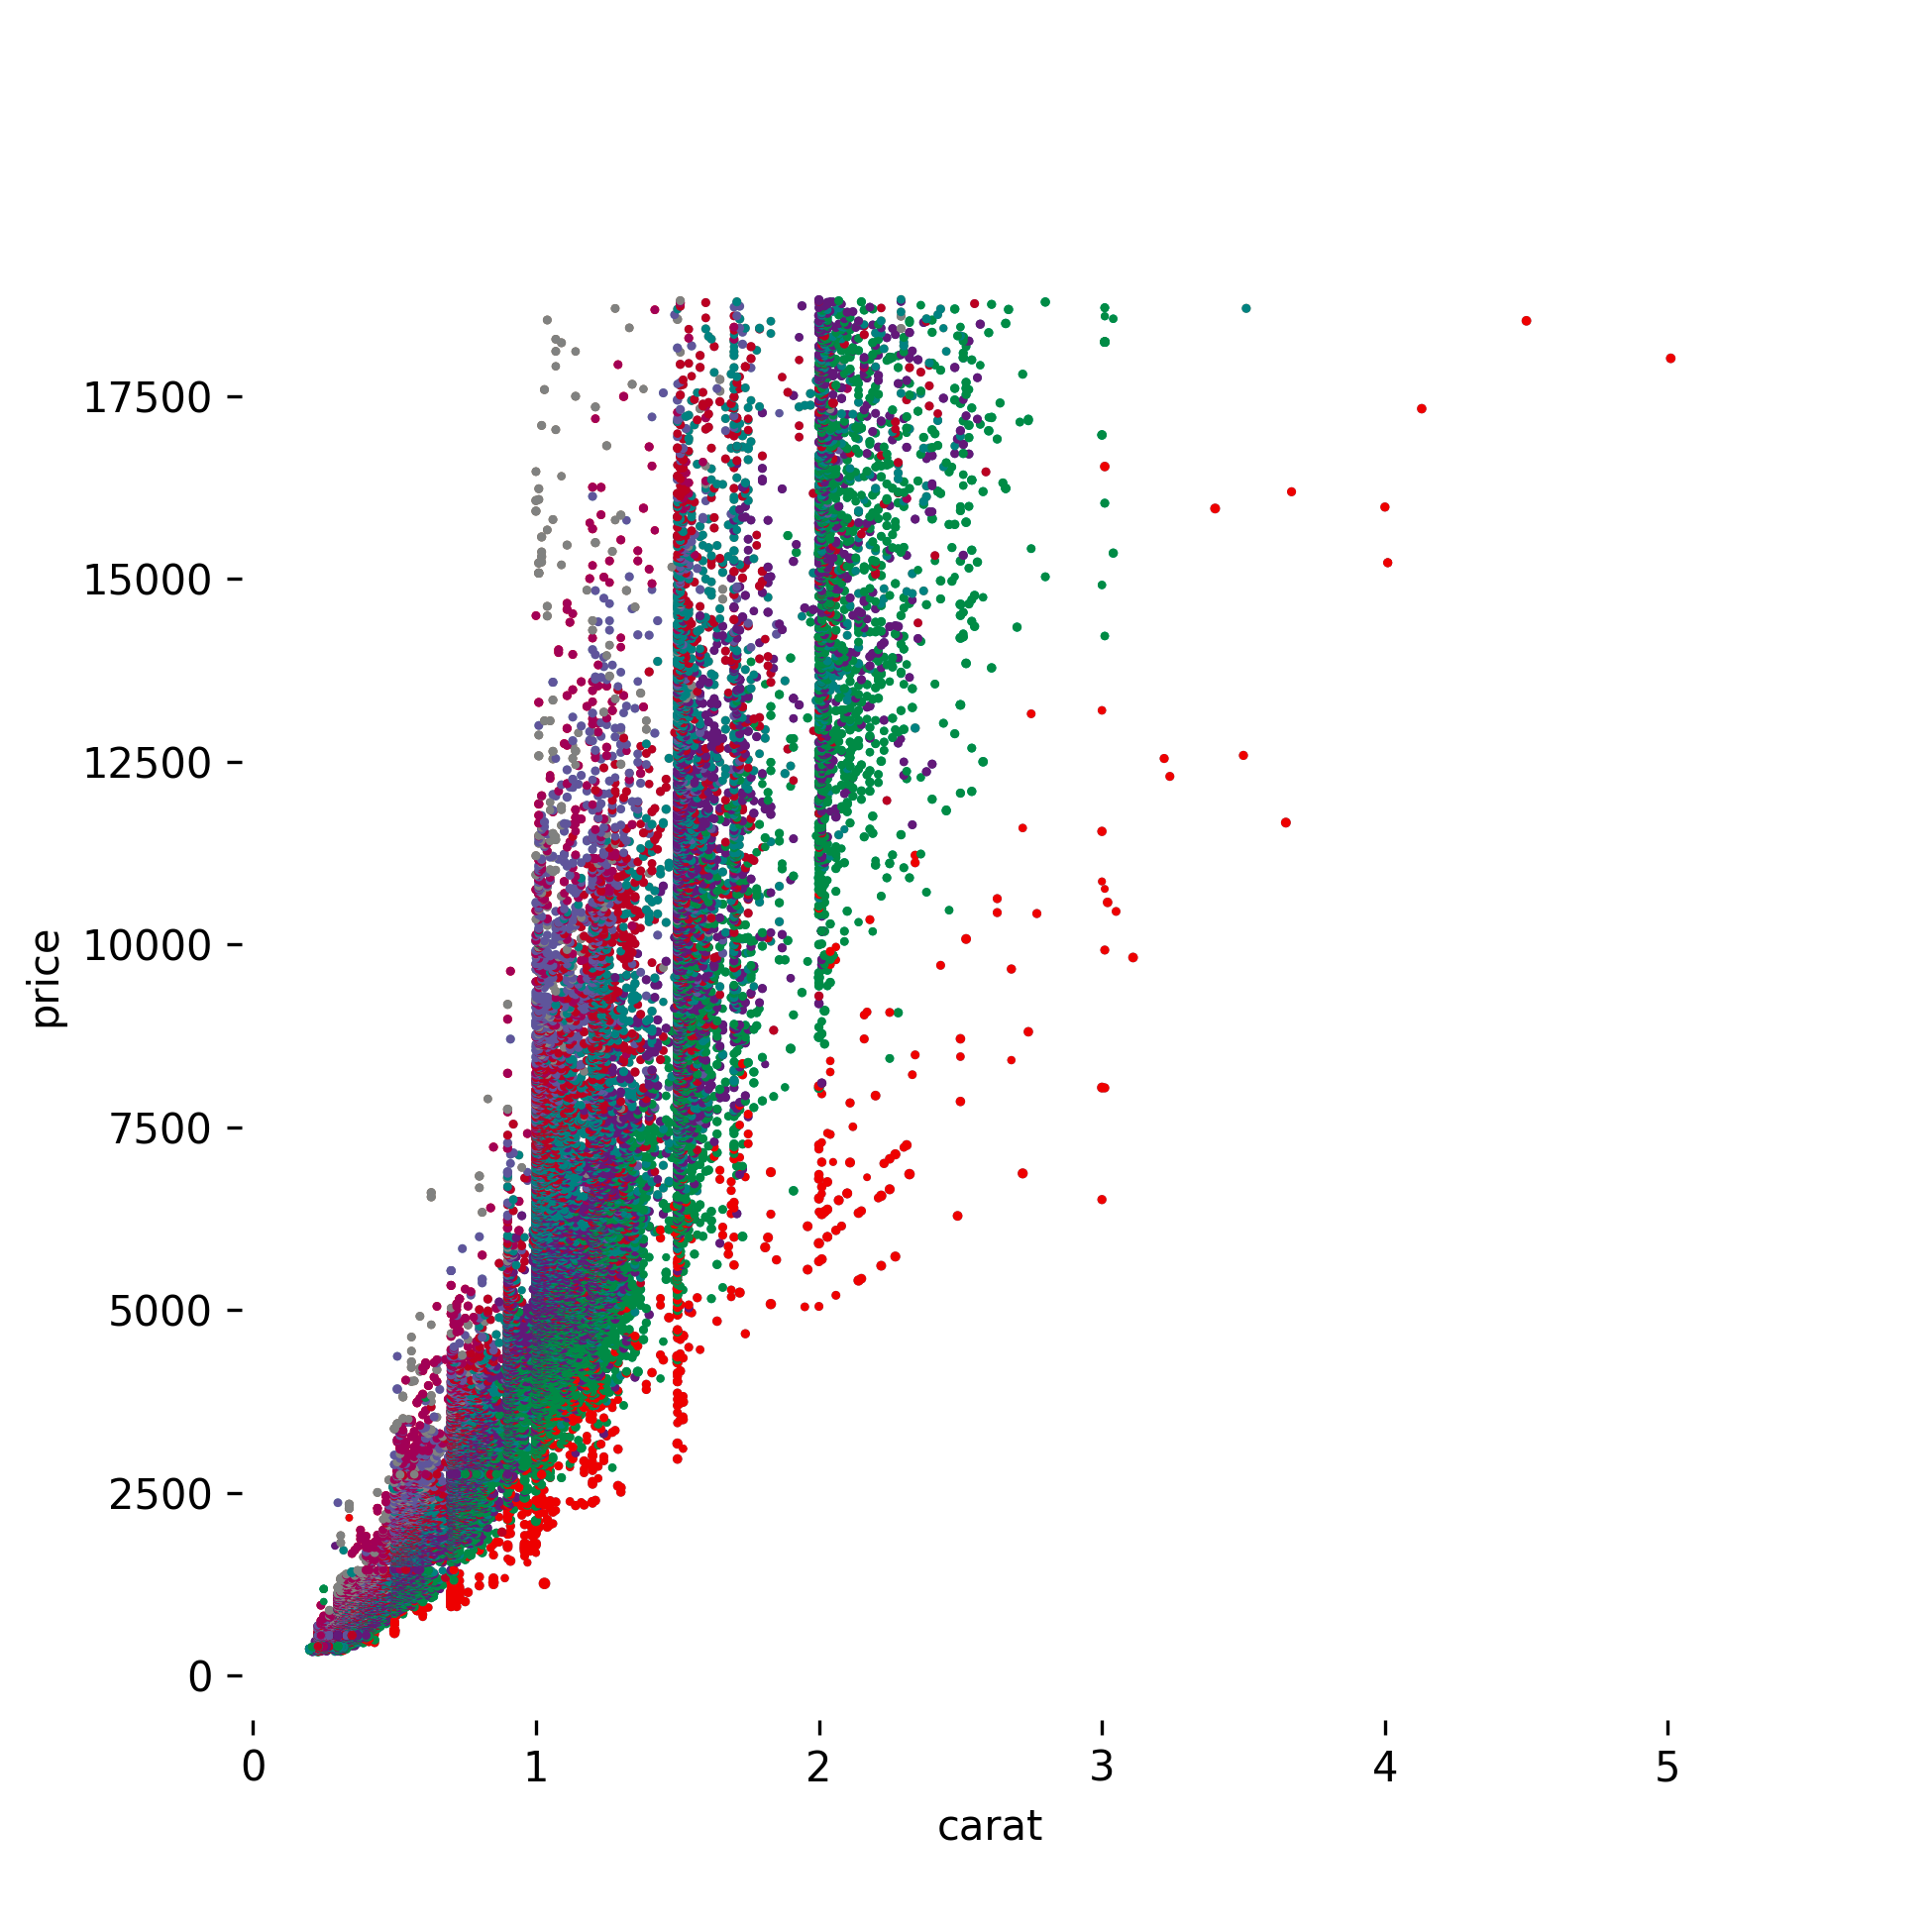
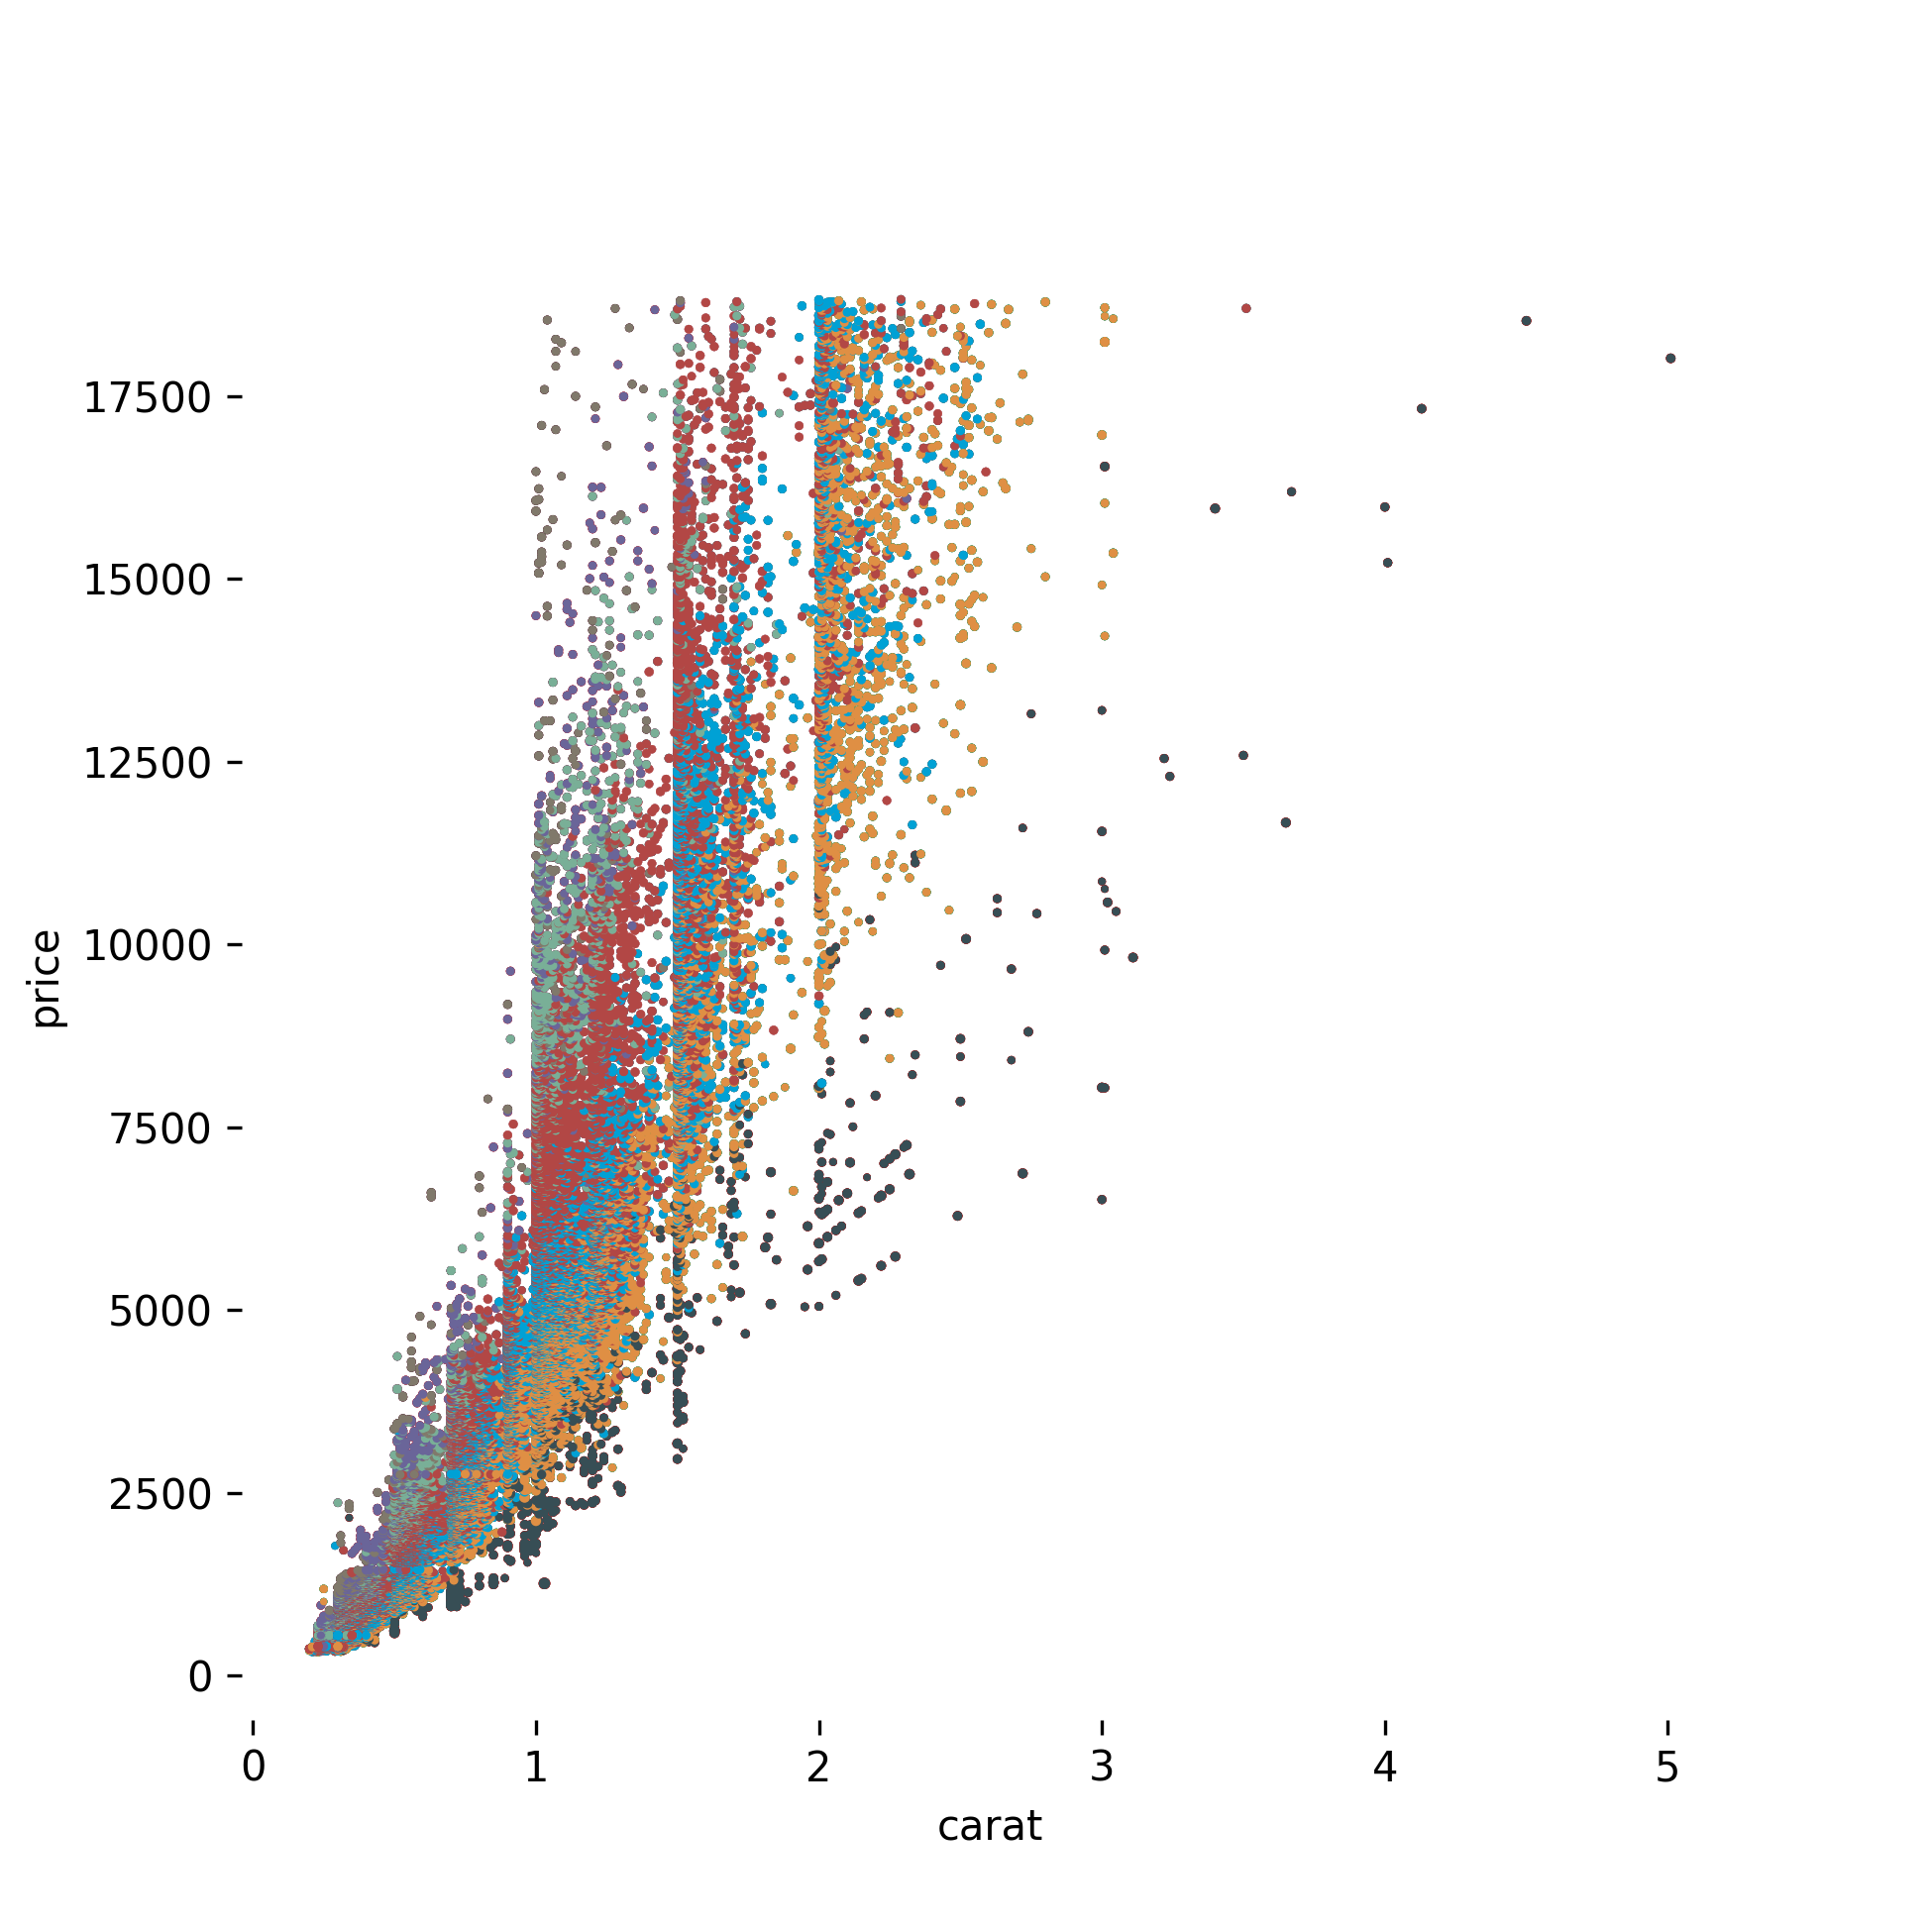
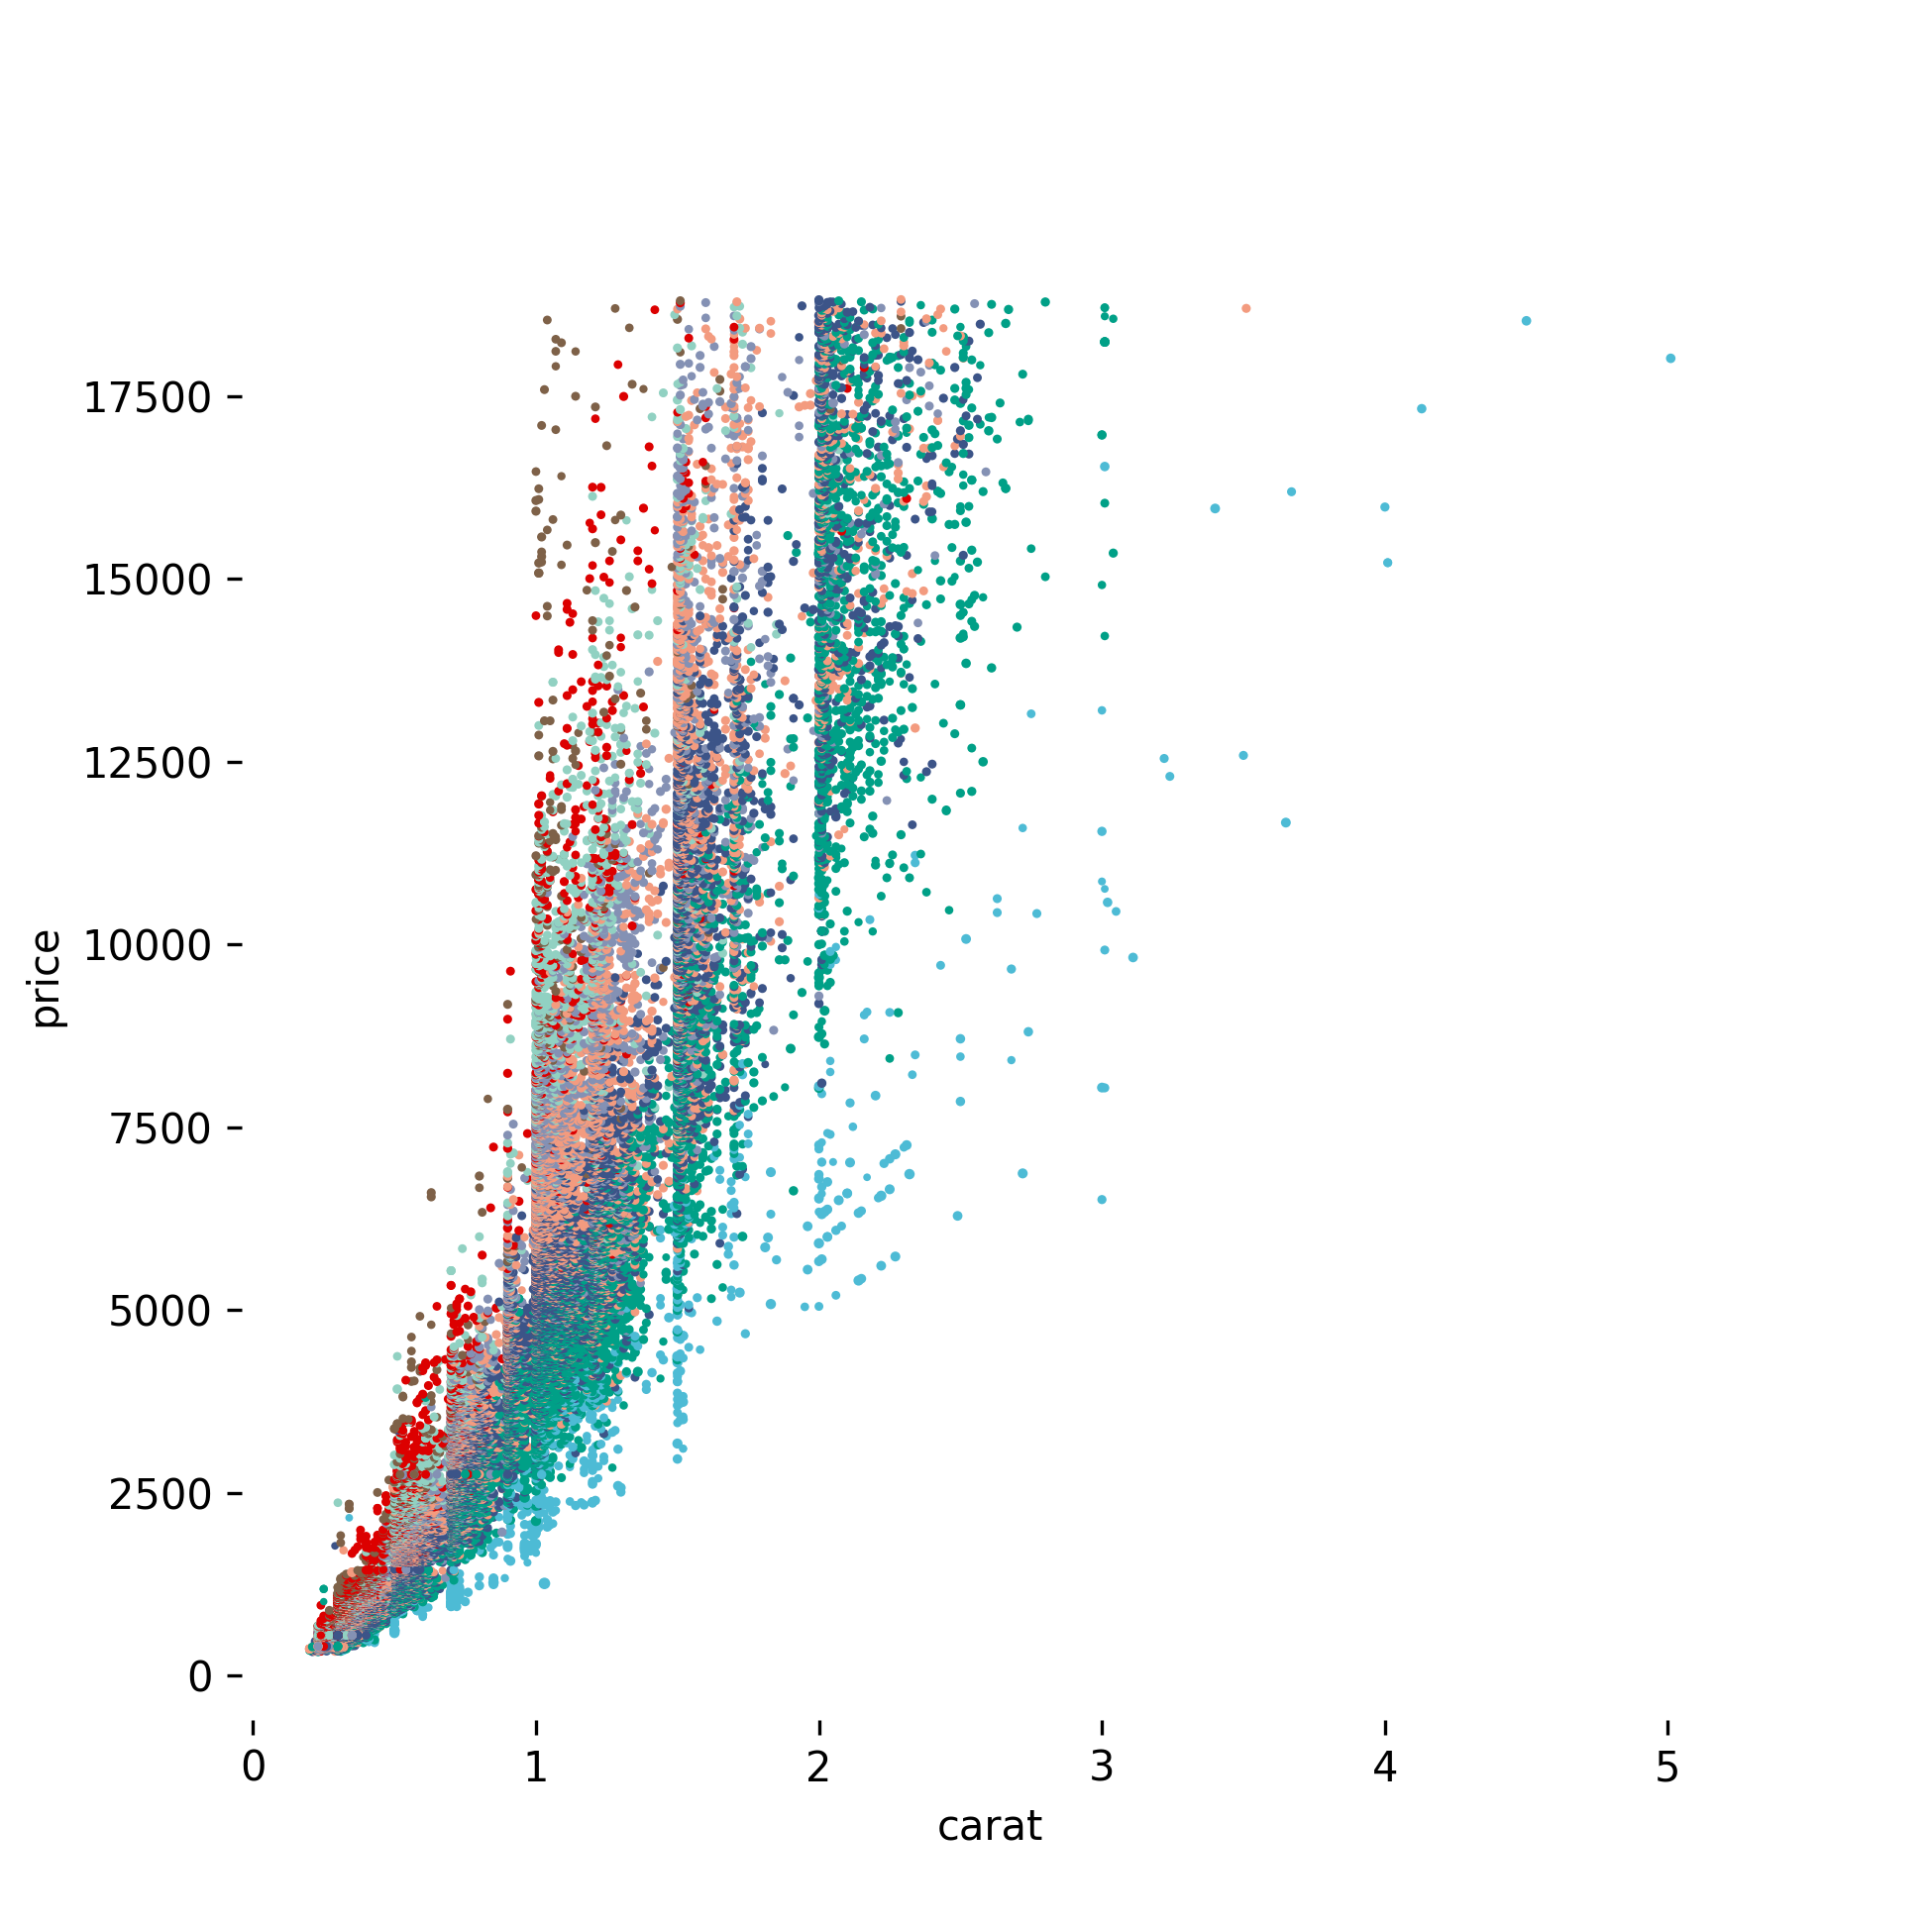
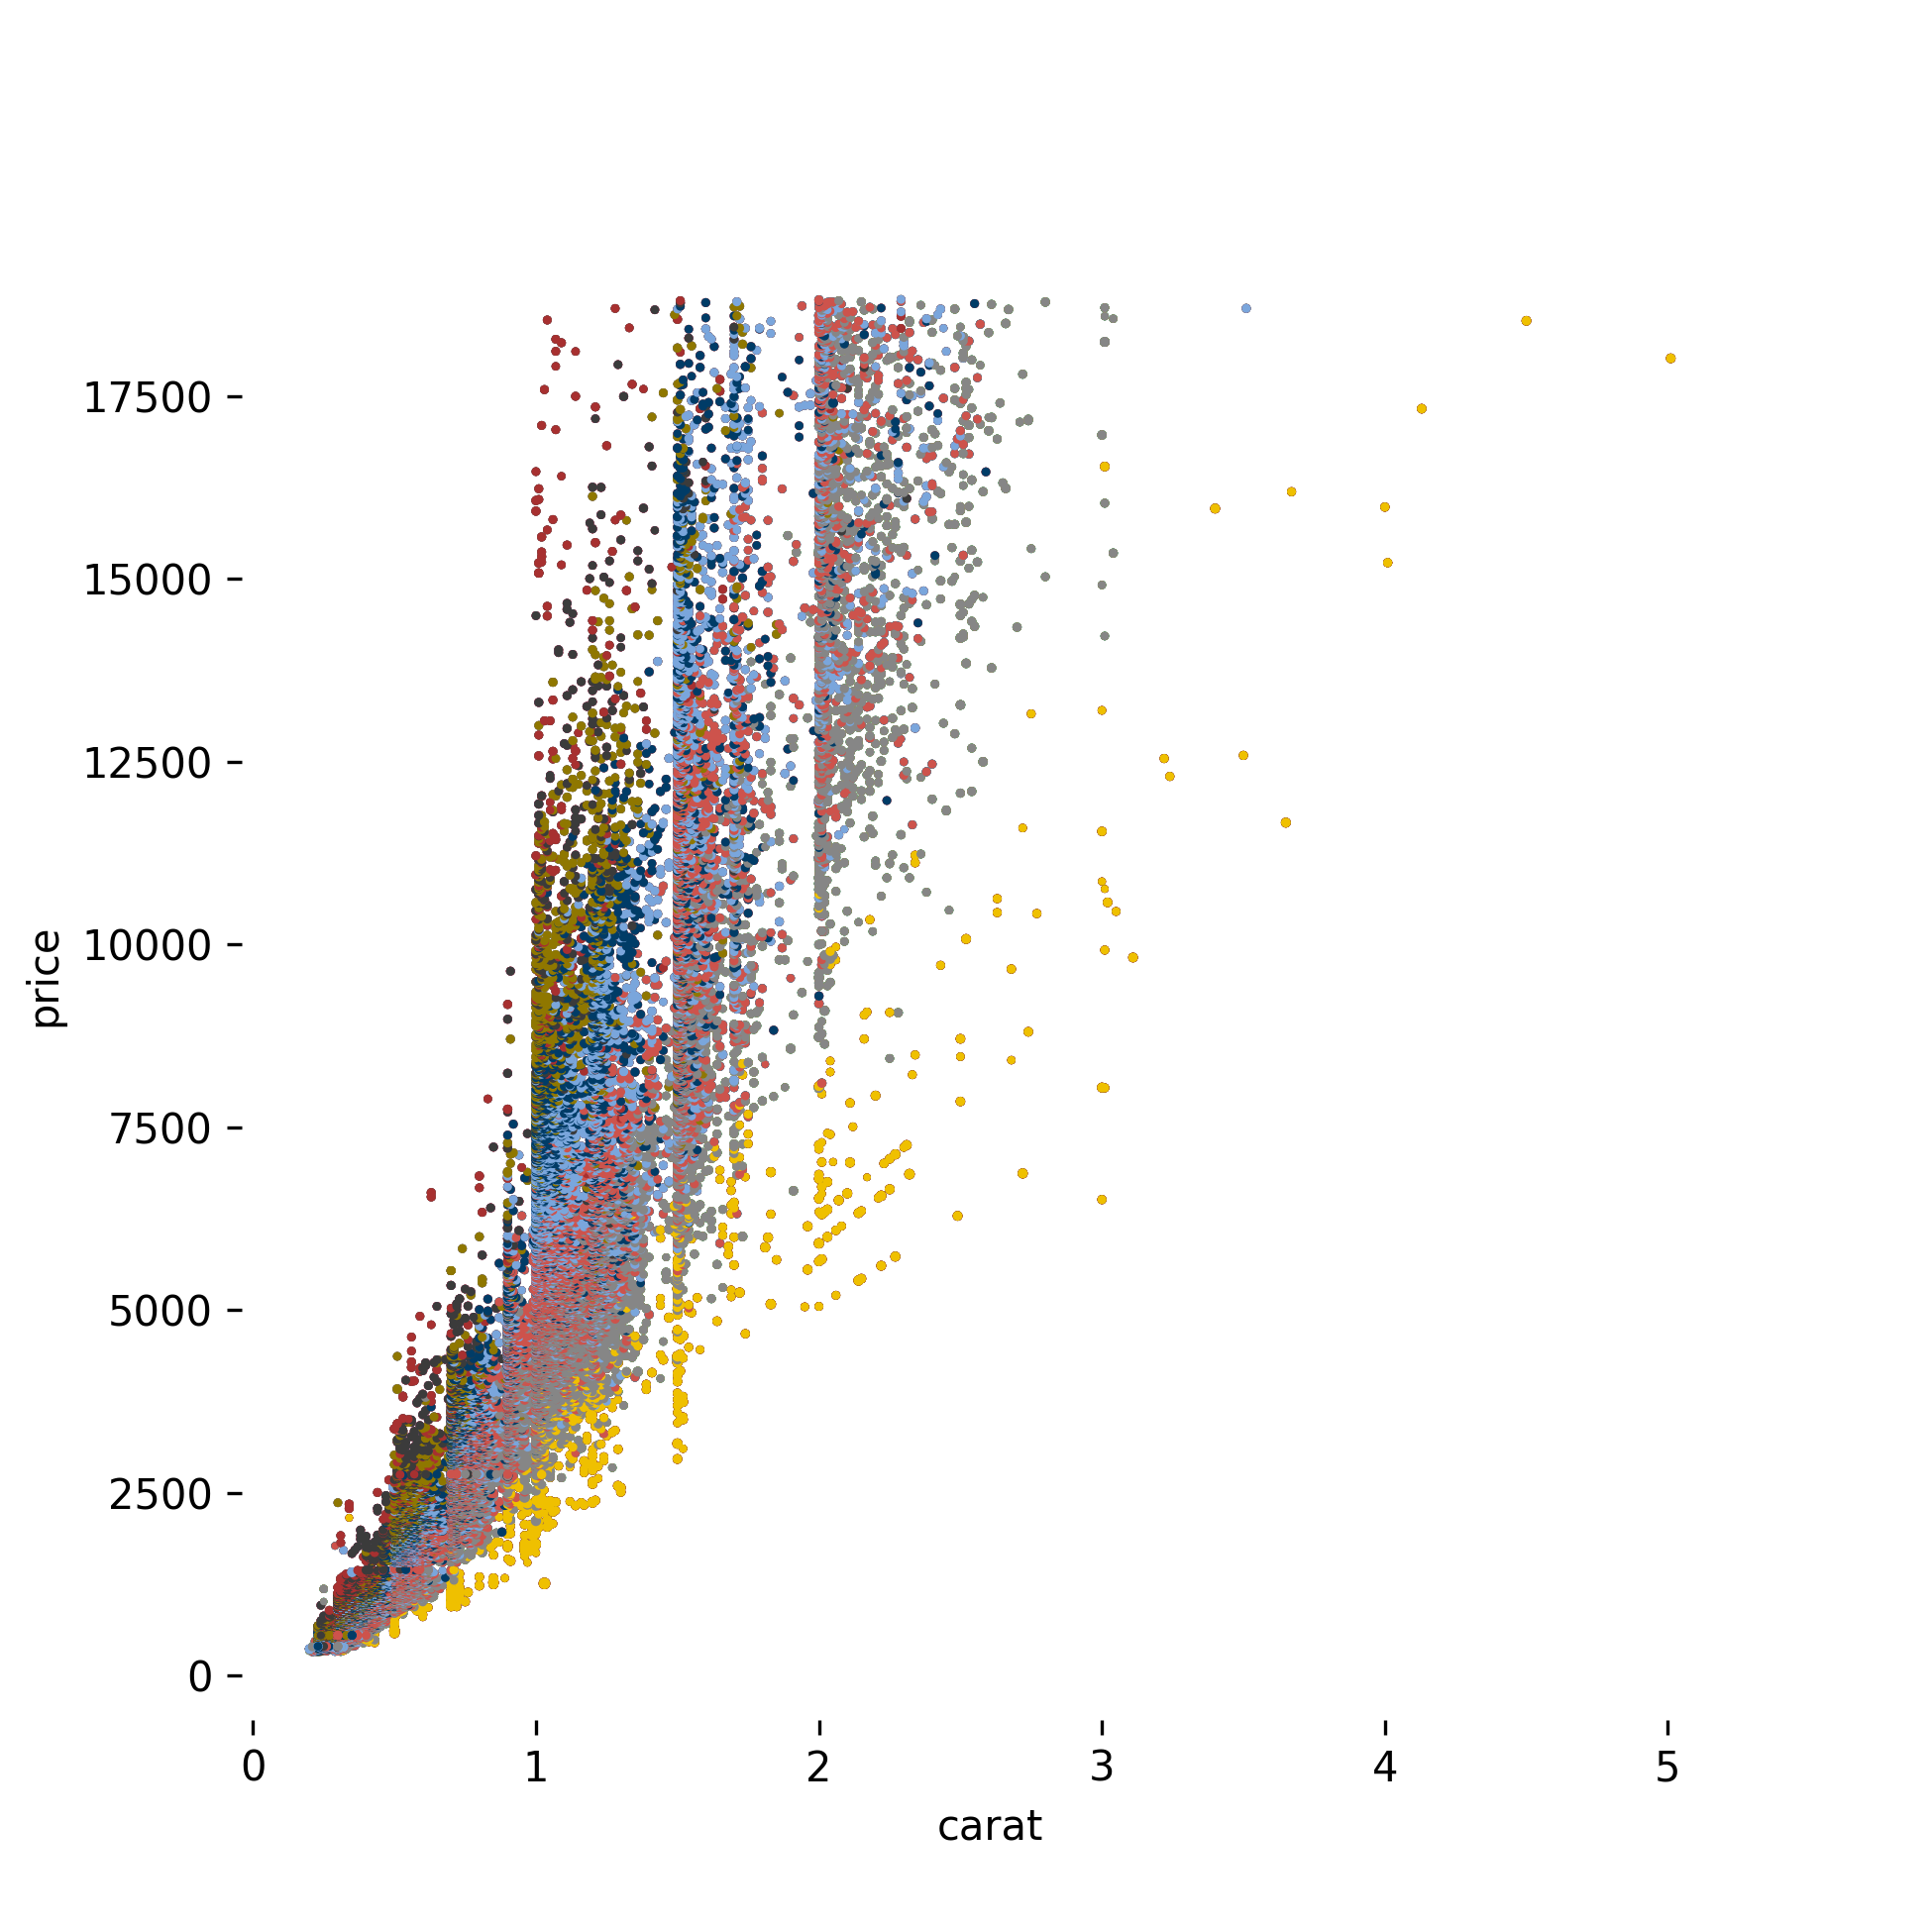
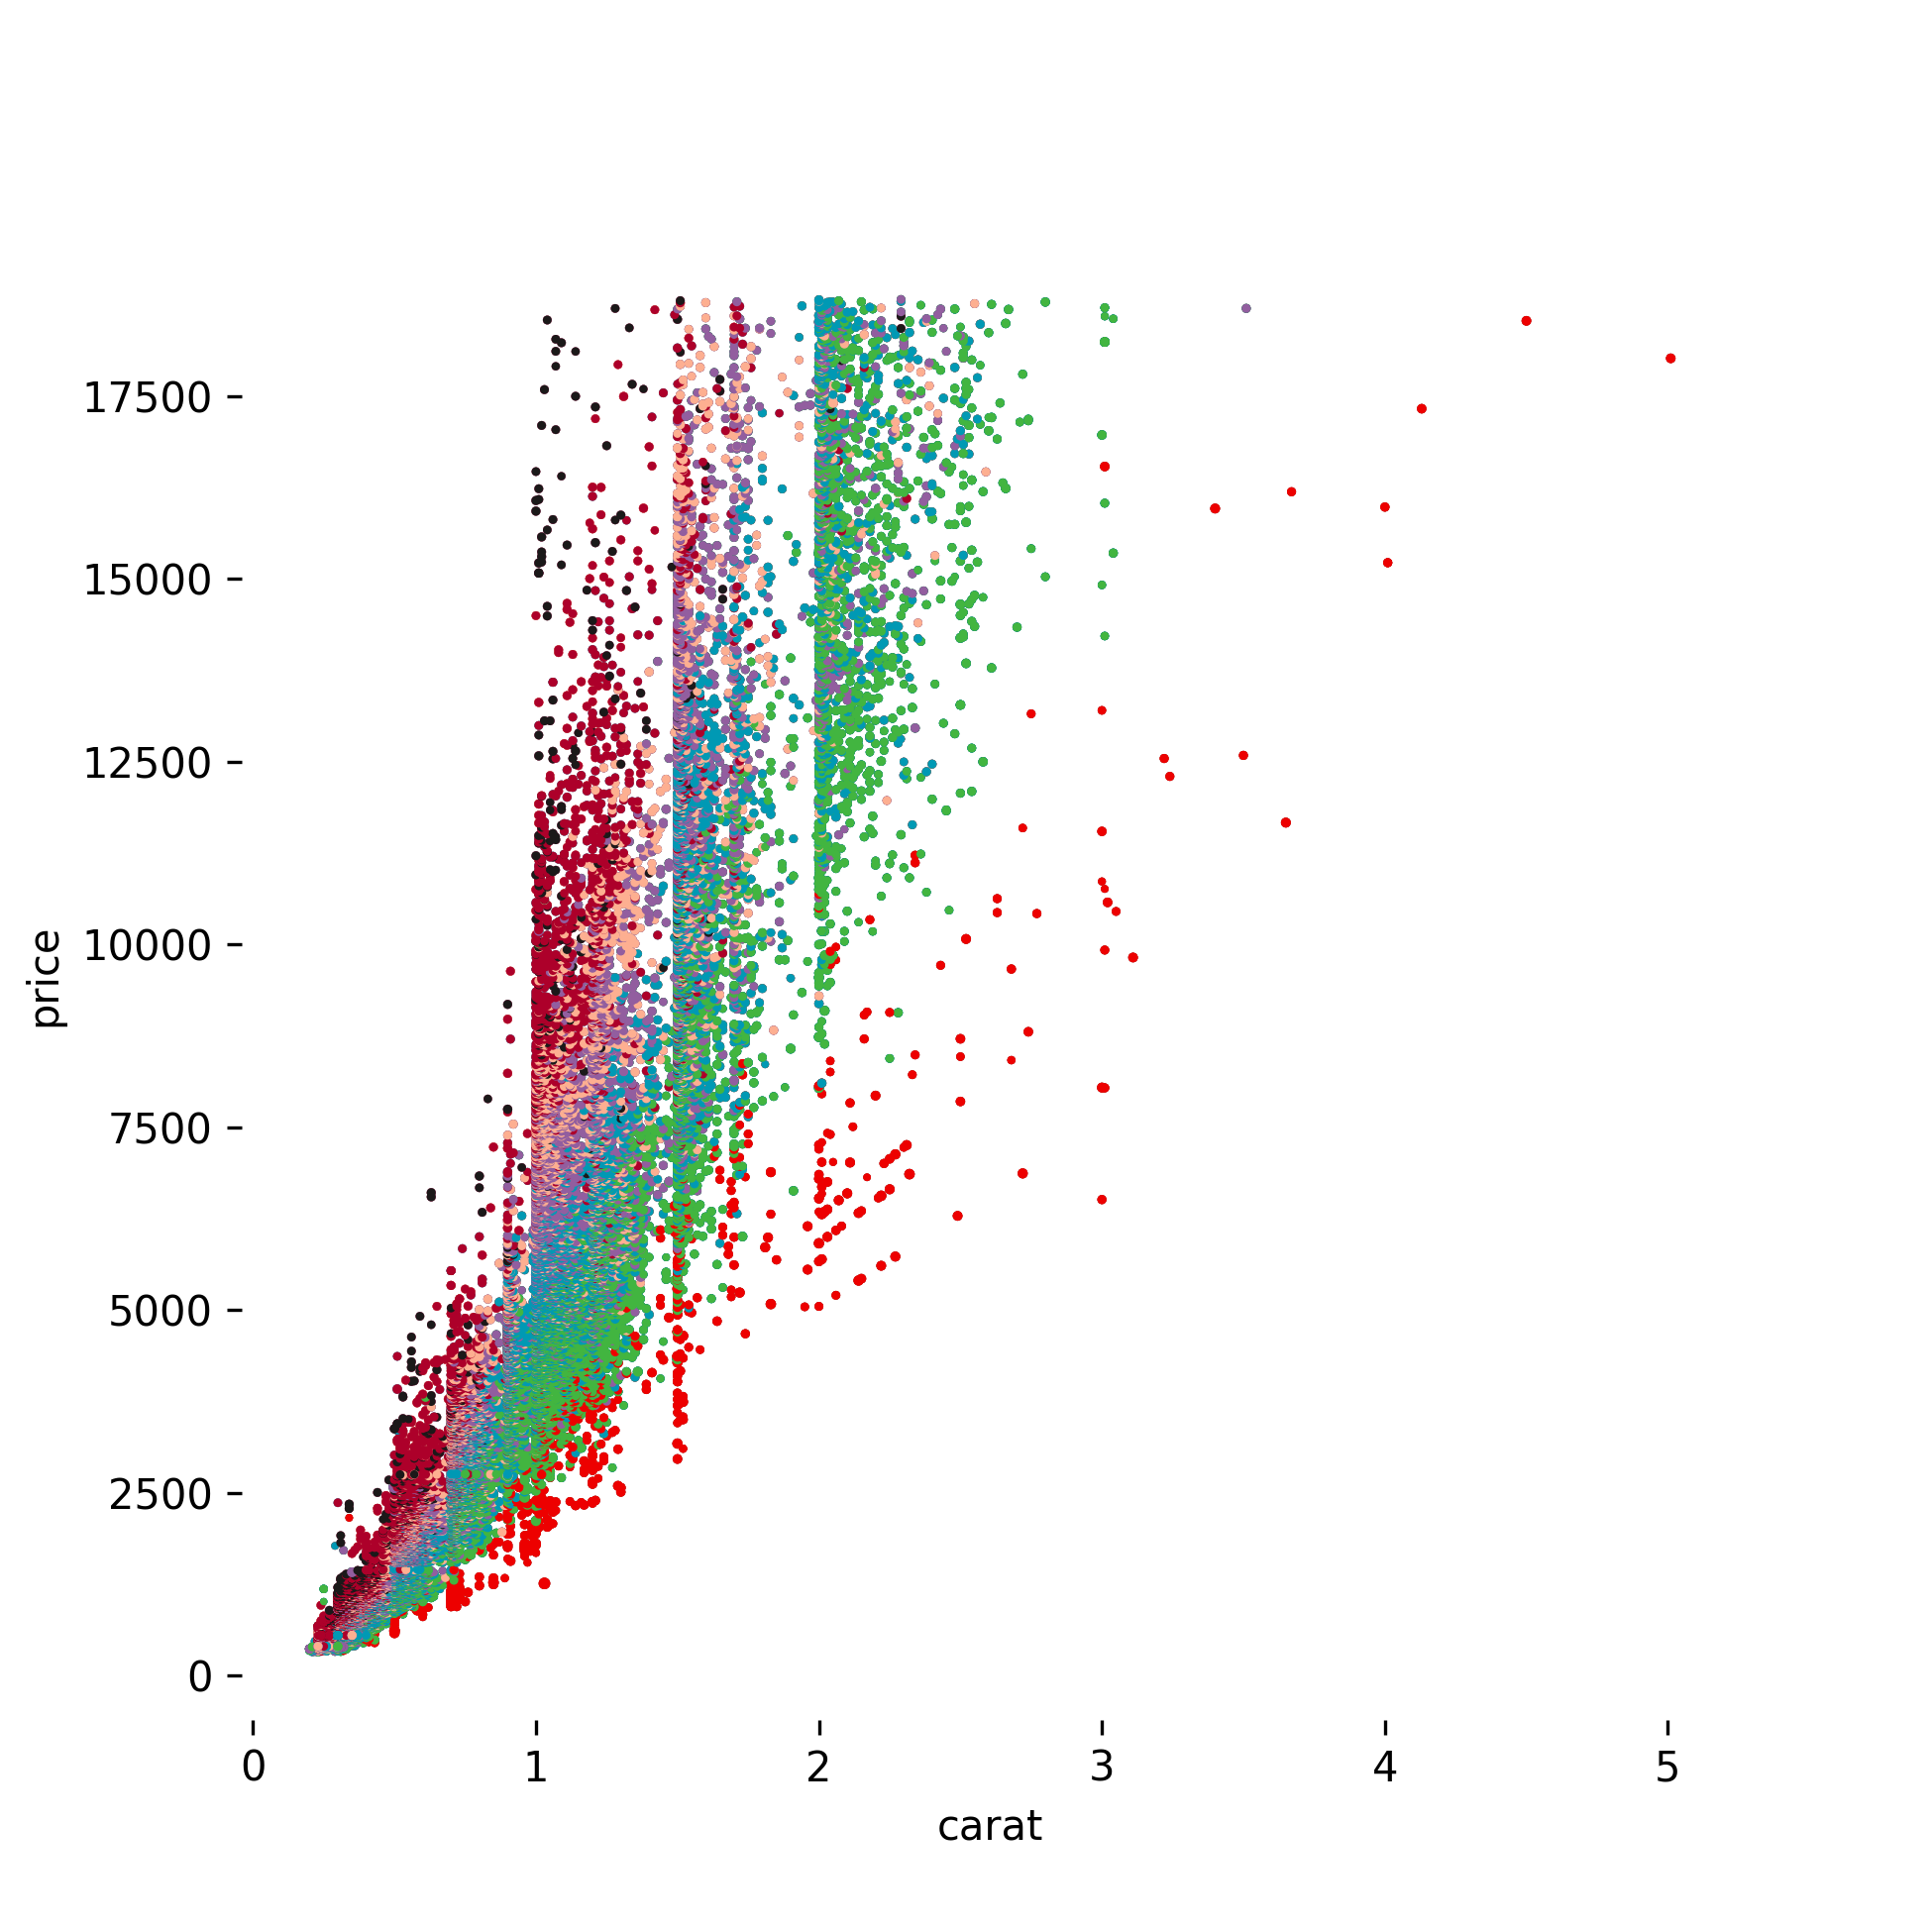
Gallery

展开查看

AAAS

JAMA

NPG

JCO

LANCET

Inspired by the R Package ggsci

Owner
Qingdong Su
Love Python, Love Programming, Love Life.
Qingdong Su
GUI for visualization and interactive editing of SMPL-family body models ie. SMPL, SMPL-X, MANO, FLAME.

Body Model Visualizer Introduction This is a simple Open3D-based GUI for SMPL-family body models. This GUI lets you play with the shape, expression, a

Muhammed Kocabas 207 Jan 01, 2023
web application for flight log analysis & review

Flight Review This is a web application for flight log analysis. It allows users to upload ULog flight logs, and analyze them through the browser. It

PX4 Drone Autopilot 145 Dec 20, 2022
Seismic Waveform Inversion Toolbox-1.0

Seismic Waveform Inversion Toolbox (SWIT-1.0)

Haipeng Li 98 Dec 29, 2022
Mathematical learnings with Lean, for those of us who wish we knew more of both!

Lean for the Inept Mathematician This repository contains source files for a number of articles or posts aimed at explaining bite-sized mathematical c

Julian Berman 8 Feb 14, 2022
This is a small program that prints a user friendly, visual representation, of your current bsp tree

bspcq, q for query A bspc analyzer (utility for bspwm) This is a small program that prints a user friendly, visual representation, of your current bsp

nedia 9 Apr 24, 2022
Simple python implementation with matplotlib to manually fit MIST isochrones to Gaia DR2 color-magnitude diagrams

Simple python implementation with matplotlib to manually fit MIST isochrones to Gaia DR2 color-magnitude diagrams

Karl Jaehnig 7 Oct 22, 2022
This is Pygrr PolyArt, a program used for drawing custom Polygon models for your Pygrr project!

This is Pygrr PolyArt, a program used for drawing custom Polygon models for your Pygrr project!

Isaac 4 Dec 14, 2021
a robust room presence solution for home automation with nearly no false negatives

Argos Room Presence This project builds a room presence solution on top of Argos. Using just a cheap raspberry pi zero w (plus an attached pi camera,

Angad Singh 46 Sep 18, 2022
Sky attention heatmap of submissions to astrometry.net

astroheat Installation Requires Python 3.6+, Tested with Python 3.9.5 Install library dependencies pip install -r requirements.txt The program require

4 Jun 20, 2022
阴阳师后台全平台(使用网易 MuMu 模拟器)辅助。支持御魂,觉醒,御灵,结界突破,秘闻副本,地域鬼王。

阴阳师后台全平台辅助 Python 版本:Python 3.8.3 模拟器:网易 MuMu | 雷电模拟器 模拟器分辨率:1024*576 显卡渲染模式:兼容(OpenGL) 兼容 Windows 系统和 MacOS 系统 思路: 利用 adb 截图后,使用 opencv 找图找色,模拟点击。使用

简讯 27 Jul 09, 2022
This is a Cross-Platform Plot Manager for Chia Plotting that is simple, easy-to-use, and reliable.

Swar's Chia Plot Manager A plot manager for Chia plotting: https://www.chia.net/ Development Version: v0.0.1 This is a cross-platform Chia Plot Manage

Swar Patel 1.3k Dec 13, 2022
Sentiment Analysis application created with Python and Dash, hosted at socialsentiment.net

Social Sentiment Dash Application Live-streaming sentiment analysis application created with Python and Dash, hosted at SocialSentiment.net. Dash Tuto

Harrison 456 Dec 25, 2022
Generate visualizations of GitHub user and repository statistics using GitHub Actions.

GitHub Stats Visualization Generate visualizations of GitHub user and repository statistics using GitHub Actions. This project is currently a work-in-

Aditya Thakekar 1 Jan 11, 2022
Plotting library for IPython/Jupyter notebooks

bqplot 2-D plotting library for Project Jupyter Introduction bqplot is a 2-D visualization system for Jupyter, based on the constructs of the Grammar

3.4k Dec 30, 2022
Bioinformatics tool for exploring RNA-Protein interactions

Explore RNA-Protein interactions. RNPFind is a bioinformatics tool. It takes an RNA transcript as input and gives a list of RNA binding protein (RBP)

Nahin Khan 3 Jan 27, 2022
Data Analysis: Data Visualization of Airlines

Data Analysis: Data Visualization of Airlines Anderson Cruz | London-UK | Linkedin | Nowa Capital Project: Traffic Airlines Airline Reporting Carrier

Anderson Cruz 1 Feb 10, 2022
Write python locally, execute SQL in your data warehouse

RasgoQL Write python locally, execute SQL in your data warehouse ≪ Read the Docs · Join Our Slack » RasgoQL is a Python package that enables you to ea

Rasgo 265 Nov 21, 2022
Make sankey, alluvial and sankey bump plots in ggplot

The goal of ggsankey is to make beautiful sankey, alluvial and sankey bump plots in ggplot2

David Sjoberg 156 Jan 03, 2023
Homework 2: Matplotlib and Data Visualization

Homework 2: Matplotlib and Data Visualization Overview These data visualizations were created for my introductory computer science course using Python

Sophia Huang 12 Oct 20, 2022
Flipper Zero documentation repo

Flipper Zero Docs Participation To fix a bug or add something new to this repository, you need to open a pull-request. Also, on every page of the site

Flipper Zero (All Repositories will be public soon) 114 Dec 30, 2022